
Page 13 - Journal of Structural Heart Disease Volume 3, Issue 2
P. 13
39
Original Scienti c Article
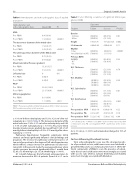
Table 6. Hemodynamic and echocardiographic data of studied population.
Table 7. Factor a ecting occurrence of signi cant Mitral regur- gitation (SMR).
Features
Outcome
P value
Failure
Success
Hemodynamic and echocardiographic data
Mean (SD)
P1
MVA
Pre PBMV
Post PBMV
The transverse diameter of the mitral valve
Pre PBMV 1.54 ( 0.37)
Post PBMV 2.43 ( 0.96)
The anteroposterior diameter of the Mitral valve
Gender
Females Males
Height
L A diameter
Rhythm
Sinus
Atrial brillation (AF)
Previous BMV/ surgery
No Yes
W.S. Thickness
1 2 3
W.S. Mobility
1 2 3
W.S. Subvalvular
1 2 3
W.S. Calci cation
1 2 3
Pre-operative MVA Pre-operative PG Pre-operative PASP
Pre PBMV
Post PBMV
Mean transmitral Pressure gradient
Pre PBMV
Post PBMV
Left atrial size
Pre PBMV
Post PBMV
PASP
Pre PBMV
Post PBMV
Mitral regurgitation Pre PBMV
Post PBMV
13.26 (5.27) 5.53 (3.15) 0
4.8(0.7) 4.2(0.6)
52.83 (13.85) 29.15 (8.94)
0.91 (0.54) 1.11 (0.56)
0.96 (0.18) 1.93 (0.29)
<0.0001
<0.0001
<0.0001
<0.0001 0%
<0.0001
<0.0001
<0.01
(50.00%) (50.00%)
166±7.76 4.88±0.83
(30.00%) (70.00%)
(90.00%) (10.00%)
(20.00%) (70.00%) (10.00%)
(20.00%) (70.00%) (10.00%)
(30.00%) (40.00%) (30.00%)
(30.00%) (40.00%) (30.00%)
1.03±0.18 24.1±4.07 52.2±13.82
(86.87%) 0.01 (13.13%)
157.24±8.25 0.002 4.60±0.49 0.11
(88.89%) <0.0001 (11.11%)
(89.90%) 0.99 (10.10%)
(29.29%) 0.78 (58.59%)
(12.12%)
(36.36%) 0.36 (60.61%)
(3.03%)
(71.72%) 0.01 (23.23%)
(5.05%)
(62.63 %) 0.051 (30.30 %)
(7.07%)
0.96±0.18 0.22 26.47±5.36 0.18 52.89±13.92 0.88
0.75 ( 0.25) 0.93 (0.20)
PBMV = Percutaneous Balloon Mitral Valvuloplasty; MVA = mitral valve areas; PASP = pulmonary artery systolic pressure.
± 0.18 cm2 before valvuloplasty and 1.93 ± 0.29 cm2 after val- vuloplasty (p < 0.0001; Table 6). The transverse diameter of the mitral valve was 1.54 ± 0.37 cm before valvuloplasty and 2.43 ± 0.96 cm after valvuloplasty (p < 0.0001). Also, trans-mitral diastolic mean pressure gradient decreased from 13.26 ± 5.27 mm Hg before valvuloplasty to 5.53 ± 3.15 mm Hg after valvu- loplasty (p < 0.0001).
Pulmonary hypertension frequently complicates mitral stenosis and may signi cantly in uence clinical ndings and prognosis. The increase in pulmonary arterial pressure is of- ten out of proportion to the degree of left atrial hypertension, which re ects a major increase in pulmonary vascular resis- tance [28]. In the present study, the average pulmonary artery systolic pressure decreased signi cantly after 1 month from 52.83 ± 13.85 mm Hg to 29.15 ± 8.94 mm Hg (p < 0.0001).
At 1-month follow-up, the left atrium anteroposterior di- mension decreased in 85% of patients (from 4.8 ± 0.7 cm to
L A= Left Atrial; W.S. = Wilkins score; BMV = balloon mitral valvotomy; MVA = mitral valve areas; PG = prostaglandin; PASP = pulmonary artery systolic pressure.
4.2 ± 0.6 cm; p < 0.0001) and remained unchanged in 15% of patients.
Factors In uencing Procedural Success
Total echocardiographic score was the strongest predic- tor of procedural success, with lower scores associated with a greater likelihood of a successful outcome (Table 7). Of the dif- ferent components of Wilkin’s score, the presence of subval- vular disease and calci cation were most strongly associated with success rate, whereas valvular thickening and mobility were most strongly associated with dilatation.
Mahmoud, S.E.S. et al.
Percutaneous Balloon Mitral Valvuloplasty
