
Page 21 - Journal of Structural Heart Disease Volume 4, Issue 1
P. 21
Original Scienti c Article 12
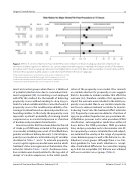
Figure 1. E ects of carotid compression major stroke/TIA post-procedure to 72 hours in subgroups. Carotid compression was shown to be neither superior nor inferior to no carotid compression with regard to combined risk of major stroke or TIA between procedure and 72 hours in subgroups known to have higher risk for stroke or TIA. Due to the low number of overall stroke and TIA events in the population studied, analysis could only be performed on the above subgroups.
◊ Interaction between prior carotid stenosis and carotid compression. p=0.34 † Interaction between atrial brillation and carotid compression. p=0.24
§ Interaction between previous stroke/TIA and carotid compression. p=0.38 ∂ Interaction between gender and carotid compression. p=0.85
ment and control groups when there is a likelihood of potential selection bias due to nonrandom treat- ment assignment [20]. As matching is not employed with IPW, this method has the bene t of balancing propensity scores without needing to drop any pa- tients for whom suitable matches cannot be found. A propensity score is the conditional probability of re- ceiving a treatment based on observed potential con- founding variables. In this study, the propensity score represents a patient’s probability of receiving carotid compression or no carotid compression as a function of baseline and procedural characteristics.
Several covariates that have been linked to the risk of stroke post-TAVR were included in the propensity score model, including new onset of atrial brillation, gender, and chronic kidney disease [21]. An initial pro- pensity score model was estimated using 27 variables described in Tables 1 and 2. To estimate propensity scores, logistic regression models were used in which treatment status was regressed on the baseline char- acteristics listed in Tables 1 and 2. Continuous base- line variables were linearly related to the log-odds of receipt of carotid compression in the initial speci -
cation of the propensity score model. Prior research on variable selection for propensity scores suggests that it is desirable to include variables that a ect the outcome [22], therefore variables that appeared to impact the outcome were included in the initial pro- pensity score model. Due to our smaller sample size, we chose to remove irrelevant covariates to avoid in- troducing “noise” into the treatment e ect estimates [22]. Propensity scores were modeled as a function of age, pre-procedure hypertension, pre-procedure atri- al brillation, previous aortic valve procedure, NYHA classi cation, anticoagulation medication within 24 hours before the TAVR procedure, TAVR procedure time, and pre-procedure aortic valve annulus size. Af- ter a propensity score was calculated for each subject, we evaluated the overlap in the range of propensity scores between groups as well as the balance (i.e., dis- tributions) across groups. Although there is no stan- dard guideline for how much imbalance is accept- able, standardized di erences for covariates ranging up to 0.25 are acceptable [23]. Balance was achieved with our covariates across groups (Table 3).
Journal of Structural Heart Disease, February 2018
Volume 4, Issue 1:9-16
