
Page 33 - Journal of Structural Heart Disease Volume 4, Issue 1
P. 33
Case Report 24
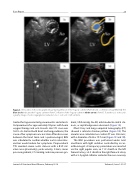
Figure 3. Intracardiac echocardiography image during in ation of the Fogarty catheter (Panel A) and a schematic image (Panel B). The blue circle indicates the Fogarty catheter. Panel C. In ation of the Fogarty catheter (white arrow). Panel D. Transthoracic echocardi- ography image of aortic regurgitation reduction. Ao = aorta; LV = left ventricle.
treated for hypersensitivity pneumonitis and intersti- tial pneumonia for approximately 10 years with home oxygen therapy and oral steroids. Her STS score was 16.5%. As she had both heart and lung problems, the cause of her symptoms was not clear. After discussion between the heart team and a pulmonologist, BAV was scheduled to con rm whether aortic valve inter- vention would reduce her symptoms. Preprocedural TTE revealed severe aortic stenosis with a 0.59 cm2 valve area (planimetry); peak velocity, 3.8m/s; mean pressure gradient, 37.2 mmHg; and max pressure gra-
dient, 59.0 mmHg. No AR, mild-moderate mitral ste- nosis, or septal bulge were observed. (Figure 1A)
Chest X-ray and lung computed tomography (CT) showed a reticular shadow pattern (Figure 1B). The annular area calculated on cardiac CT was 356 mm2, with a diameter of 24.6 × 19.7 mm (Figure 1C and 1D).
The BAV procedure was performed under local anesthesia with light sedation controlled by an an- esthesiologist. A temporary pacemaker was inserted via the right jugular vein, an 11-F sheath in the left femoral artery, a 5-F sheath in the right femoral artery with a 5-F pigtail catheter seated in the non-coronary
Journal of Structural Heart Disease, February 2018
Volume 4, Issue 1:21-27
