
Page 85 - Journal of Structural Heart Disease Volume 5, Issue 4
P. 85
147
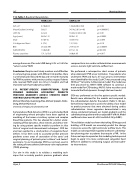
112. Table 1. Baseline Characteristics.
Meeting Abstracts
TAVR n=53
SAVR n=67
AVA cm2
Mean Gradient (mmHg) LVEF (%)
Age (years)
Male
% Indigenous Maori BMI
EUROSCORE 2
Plasma creatinine
0.78±0.03 58±21 42±24 68.5±1.31 43 (81%)
4 (7%) 26.2±0.786 13.8±3.80 131.1±13.8
1.04±0.88 (n=38) 36.14±2.81 (n=46) 55.99±10.90 (n=46) 60.0±1.31
44 (65.7%) 13 ( 19%) 29.91±0.57 8.71±1.29 99.8±4.63
p =0.02
p =0.0000012 p =0.61
p =0.0003
p =0.093
p =0.10
p =0.00035 p=0.0378
p =0.017
average Euroscore II for redo SAVR being 5.3% vs 19.4% for “valve-in-valve” TAVR.
Conclusion: Despite small study numbers and difficulties in comparing two groups with different risk profiles, there is a trend towards reduced 30-day and 12-month mortality for TAVR in patients with previous cardiac surgery. Patients who received TAVR spent less time in hospital and had improved valve haemodynamic profiles.
113. PATIENT-SPECIFIC COMPUTATIONAL FLUID DYNAMIC MODELING ACCURATELY PREDICTS PRESSURE GRADIENTS ACROSS STENOTIC RIGHT VENTRICULAR OUTFLOW TRACTS
Michael Shorofsky, Xuanming Zhao, Michael Spaeder, Haibo Dong, Michael Hainstock
University of Virginia, Charlottesville, USA
Computational fluid dynamics (CFD) is a well-studied field of engineering whose principles have been applied to modeling of the human circulatory system and complex blood flow patterns. This has allowed for a better under- standing of flow dynamics, shear stresses, and device test- ing by using patient specific models to perform in silico trials of surgical and interventional techniques1. CFD has also been applied to a small portion of congenital heart defects. It has been used to accurately predict pressure gradients across areas of coarctation of the aorta2 and surgical planning of patients prior to Glenn3 and Fontan4 operations. To our knowledge CFD has not been used in the setting of transcatheter pulmonary valve replacement (TPVR) planning.
Our aim in this study is to validate a modeling tech- nique that accurately predicts pressure gradients when
compared to in vivo cardiac catheterization measurements across a stenotic right ventricle outflow tract.
We performed a retrospective chart review of patients who underwent TPVR at our institution. Five patients who underwent TPVR and had a CT scan prior to intervention were identified for this study. Each CT was processed using 3D Slicer5,6 to build a 3-dimensional model. The model was then processed via ANSYS ICEM software to construct a mesh model for CFD testing. ANSYS Solver was then used to model the fluid dynamics through the heart model.
CFD was performed on the five patient specific models. Results were obtained for the models and compared to the catheterization data for the patient (Table 1). We per- formed linear regression to assess the ability of our model to predict pressures that were obtained during cardiac catheterization. Linear regression demonstrated a very strong correlation between our model gradients and the catheterization gradients with an adjusted R2 of 0.99. Model coefficient values were b1=0.93 and b0=3.29 (p-0.001).
This validation study has shown that taking 3D images and building a CFD model can accurately predict the change in pressure across the right ventricular outflow tracts. This model can subsequently be applied to the pre-catheteriza- tion planning prior to patients that require a PVR. In the future, we hope to expand on this modeling technique and begin to apply it to more complicated congenital heart defects in addition to simulating surgical and transcathe- ter interventions.
Hijazi, Z
22nd Annual PICS/AICS Meeting
