
Page 18 - Journal of Structural Heart Disease Volume 4, Issue 3
P. 18
75
Original Scienti c Article
in absolute and indexed measurements (relative to body surface areas). The values of the four respective parameters after indexing in group II versus group I, respectively, were as follows: (i) left atrium coronal 54.2 mm SD 14.18 vs. 46.7 mm SD 11.05 (p = 0.013); (ii) left atrium lateral 38.08 mm SD 9.8 vs. 33.16 mm SD 7.48 (p = 0.017); (iii) left atrium anteroposterior 32.67 mm SD 9.59 vs. 26.9 mm SD 7.3 (p = 0.005); and (iv) left atrium volume 19.9 cm3 SD 10.4 vs. 14.8 cm3 SD 10.6 (p = 0.05). Only the absolute left atrium ante- ro-posterior dimension was not signi cantly di erent between the two groups. Further, the degree of sep- tal attening was more in patients in Group II (41.7% vs. 16.4, p = 0.016), indicating greater right ventricle volume overload caused by larger Qp:Qs.
Device related parameters
The ratios of the device waist diameter to the pa- tient weight and length were signi cantly larger in group II: respectively (1.04 SD 0.44 vs. 0.71 SD 0.31, p < 0.001) and (0.15 SD 0.05 vs. 0.12 SD 0.04, p = 0.003). Moreover, the ratios of the device waist diameter to left atrial coronal, lateral and antero-posterior lengths were signi cantly larger in group II: respectively (0.46 SD 0.14 vs. 0.37 SD 0.11, p = 0.003); (0.67 SD 0.23 vs. 0.53 SD 0.18, p = 0.006); (0.77 SD 0.25 vs. 0.66 SD 0.22, p = 0.04).
Hemodynamic parameters and procedure times
The right ventricle systolic pressure and the mean pulmonary artery pressure were signi cantly high- er in group II: respectively (32.48 mmHg SD 9.87 vs. 27.91 mmHg SD 7.38; p = 0.027), (19.78 mmHg SD 6.79 vs. 16.48 mmHg SD 3.9; p = 0.008). Additionally, the total procedure time, the uoroscopy time and time between the beginning of device deployment and release were signi cantly longer in group II: re- spectively (93.32 min SD 45.4 vs. 49.8 min SD 18.13; p < 0.001), (25.92 min SD 15.36 vs. 10.92 min SD 6.71; p < 0.001), (40.72 min SD 57 vs. 6 min SD 2.1; p < 0.001).
Predictors of procedure prolongation
Monovariate analysis revealed that the signi - cant predictors of prolonged procedure were as fol- lows: smaller and younger patients, larger ASD size, smaller LA dimensions, and larger device waist ratio to body weight, body length and LA dimensions (Ta-
ble 3). Multivariate analysis by backward stepwise logistic regression revealed that de cient septal rim toward superior vena cava (odds ratio: 6.89 [95% CI 1.56 – 30.44], p = 0.011; best cut-o value < 12 mm) and large device waist diameter in relation to patient body length (odds ratio 7.28 [95% CI 1.78 – 29.85], p = 0.006; best cut-o value > 0.13) were signi cant pre- dictors for prolonged procedure (Table III).
The Receiver operating characteristic (ROC) curves
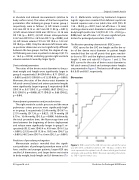
ROC curves for the SVC rim length and for the ra- tio of the device waist diameter to patient length revealed that the cut-o points that gave sensitivi- ty close to 95% and the highest speci city were rim length 12 mm and ratio 0.13 (Figures 1 and 2). The ROC curves for the ratio of device waist diameter to left atrial coronal, lateral and anteroposterior lengths are presented in Figure 3. The best cut-o values were 0.4, 0.59 and 0.67, respectively.
Discussion
Figure 1. ROC curve for the SVC rim size. Area under the curve was 0.63 (95% con dence interval 1.56 - 30.44, p = 0.011). The circle represents the optimal cut-o values which give the best sensitivity and speci city. ROC = Receiver-operating characteris- tic; SVC = Superior venae cava.
El-Segaier M. et al.
Predictors for Prolonged ASD Closure
