
Page 16 - Journal of Structural Heart Disease Volume 5, Issue 2
P. 16
29
Original Scientific Article
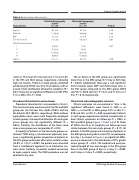
Table 2. Baseline Patient Characteristics.
Age, yrs
Male sex
BMI
STS risk score, %
NYHA functional class I
II III IV
LVEF, %
81 ± 8 12 (50.0) 31 ± 8 7.7 ± 4.6
0 (0.0) 3 (12.5) 13 (54.2) 8 (33.3) 51 ± 11
81 ± 8 38 (49.4) 29 ± 6 7.8 ± 3.5
1 (1.3)
5 (6.5) 40 (51.9) 31 (40.3) 53 ± 14
0.78 0.96 0.15 0.87
0.67
0.58
Characteristic
Portable Angiography System
(n = 24)
Mounted Angiography System
(n = 77)
P Value
(Table 2). The mean STS risk score was 7.7% and 7.8% in the PAS and MAS group, respectively, indicating high risk cohorts. Patients in both groups exhibited predominantly NYHA class III or IV symptoms, with an overall similar distribution of baseline symptoms (P = 0.67). There was no significant difference in LVEF (PAS, 51% vs MAS, 53%, P = 0.58).
Procedural characteristics and outcomes
Procedural characteristics are provided in Table 3. The most commonly used camera in the PAS and MAS group was the Siemens Cios Alpha (70.8%) and the GE Advantx DLX (80.5%), respectively. While balloon expandable valves were more frequently employed in both groups, the overall distribution of valve types across groups was not significantly different (P = 0.053). Similarly, the distribution of the three valve sizes across groups was comparable (P = 0.95).
A majority of patients in the two study groups un- derwent TAVR using a transfemoral approach; how- ever, a significantly greater proportion of patients in the PAS group underwent alternative vascular access (25.0% vs 1.3%, P = 0.001). No patient was converted from a transfemoral approach to an alternative vas- cular route. Similarly, no patient needed conversion to open surgical repair. The TAVR procedure was not aborted in any case.
The air kerma in the PAS group was significantly lower than in the MAS group (371 mGy vs 683 mGy, P = 0.043). Additionally, there was a non-significant trend towards lower DAP and fluoroscopy time in the PAS group compared to the MAS group (6566 cGy*cm2 vs 9016 cGy*cm2, P = 0.27; and 17 min vs 21 min, P = 0.16, respectively).
Clinical and echocardiographic outcomes
Clinical outcomes are summarized in Table 4. No significant differences were found in LVEF1-day or LVEF30-day in the PAS vs MAS group (54% vs 56%, P = 0.50; and 52% vs 53%, P = 0.80, respectively). Patients in each group experienced marked improvement in heart failure symptoms on follow-up (P < 0.001 in PAS and MAS group, Figure 1, Panel A and B). Rates of NYHA class III or IV symptoms on follow-up were similar between the two study groups (P = 0.17). All patients in the PAS group and a majority of patients in the MAS group had grade II or less PVL on postopera- tive day 1. As shown in Figure 2, no significant differ- ence was observed in the distribution of PVL grades across groups (P = 0.22). The hospital and post-pro- cedural length of stay were longer in the PAS group than in the MAS group (3 days vs 2 days, P = 0.005; and 3 days vs 2 days, P = 0.003, respectively).
Ahmed B. et al.
TAVR Using Portable Fluoroscopy
