
Page 17 - Journal of Structural Heart Disease Volume 5, Issue 2
P. 17
Original Scientific Article 30
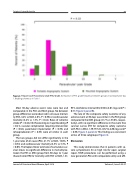
Figure 2. Frequency of Paravalvular Leak (PVL) Grade. Comparison of PVL grade frequency between groups on postoperative day 1. Grading scheme as in Table 1.
Most 30-day adverse event rates were low and comparable in the PAS and MAS group. No between group differences were observed in all-cause mortali- ty (PAS, 4.2% vs MAS, 2.6%, P = 0.56) or cardiovascular mortality (4.2% vs 1.3%, P = 0.42). Rates of ischemic stroke (P = 0.42), life threatening or major bleeding (P = 0.21), vascular complication requiring intervention (P = 0.62), pacemaker implantation (P = 0.39), and rehospitalization (P = 0.35) were all similar in each group.
The two groups did not differ significantly in the 1-year rates of all-cause (PAS, 21.7% vs MAS, 16.0%, P = 0.54) and cardiovascular mortality (4.3% vs 5.3%, P = 0.85). The Kaplan-Meier estimate of cumulative sur- vival shows no significant difference in mortality be- tween the PAS vs MAS group from 30-days to 1-year (hazard ratio [HR] for mortality with PAS vs MAS, 1.41;
95% confidence interval [CI], 0.50 to 4.01; log-rank P = 0.51; Figure 3, panel B).
The rate of the composite safety outcome of any adverse event at 30 days was similar in the PAS group compared to the MAS group (41.7% vs 33.8%, respec- tively), with no significant difference in the event free survival curves (HR for composite safety outcome with PAS vs MAS, 1.39; 95% CI, 0.67 to 2.88; log-rank P = 0.36; Figure 3, panel A). This finding was consistent across all three subgroups (Figure 4).
Discussion
This study demonstrates that in patients with se- vere symptomatic AS at high risk for open surgical repair, TAVR procedures can be performed using a new generation PAS with comparable safety and effi-
Journal of Structural Heart Disease, April 2019
Volume 5, Issue 2:25-37
