
Page 19 - Journal of Structural Heart Disease Volume 5, Issue 2
P. 19
Original Scientific Article 32
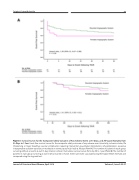
Figure 3. Survival Curves for the Composite Safety Outcome of Any Adverse Event at 30 Days, and All-Cause Mortality from 30-Days to 1-Year. Event-free survival curves for the composite safety outcome of any adverse event (mortality, ischemic stroke, life threatening or major bleeding, vascular complication requiring intervention, pacemaker implantation, rehospitalization, excessive intraoperative radiation exposure, or moderate or severe paravalvular leak) at 30 days (Panel A). The number of patients in each group surviving without an event at each 5-day interval is shown. Cumulative survival curves from day 30 to 1 year (Panel B). The number of patients in each group surviving at each interval (varies) is shown. Event rates were calculated using the Kaplan-Meier estimate and compared using the log-rank test.
Journal of Structural Heart Disease, April 2019 Volume 5, Issue 2:25-37
