
Page 16 - Journal of Structural Heart Disease Volume 5, Issue 3
P. 16
55
Original Scientific Article
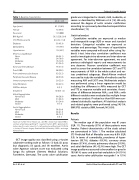
Table 1. Baseline characteristics Age (years)
Female
Caucasian
BMI (kg/m2)
STS PROM score (%) Diabetes Dyslipidemia Hypertension
Chronic Lung Disease None
Mild Moderate Severe
Coronary Artery Disease Prior CABG
Prior cerebrovascular disease Peripheral Vascular Disease Immunocompromised
Atrial fibrillation ESKD on dialysis Creatinine
Mitral Regurgitation None/trace
Mild
Moderate
Severe
Aortic Regurgitation None/Trace
Mild
Moderate
Severe
81 (74, 85) 72 (56.6) 112 (88.8) 26.2 (22.8, 29.4) 8.9 (5.9, 11.8) 55 (43.3) 119 (93.7) 119 (93.7)
56 (44.1) 24 (18.9) 16 (12.6) 31 (24.4)
73 (57.4) 38 (30.0) 32 (25.2) 48 (37.8) 29 (22.9) 54 (42.5) 4 (3.1) 1.0 (0.8, 1.2)
36 (28.3) 51 (40.2) 31 (24.4) 9 (7.1)
50 (39.4) 53 (41.7) 20 (15.7) 4 (3.1)
grade was categorized as absent, mild, moderate, or severe as described by Willmann et al [18]. We only assessed the degree of aortic annular calcification according to a previously described semiquantitative classification [19].
Statistical analysis
Quantitative variables are expressed as median and interquartile range (IQR) or mean and standard deviation. Categorical variables are expressed as number and percentage. The means of quantitative variables were compared with each other using Stu- dent’s t-test. Intra-class correlation coefficient was used to investigate intra-observer and inter-observer agreement. For inter-observer agreement, we used previous radiologists’ reports and measurements by one observer. Pearson correlation coefficient was used to assess the correlation between CCT and TTE measurements of AVA in the whole cohort and var- ious predefined subgroups. Bland-Altman method was used to study the variability of methods used for measuring AVA and LVOT area. Multivariate analysis was performed using a linear regression model by including the difference in AVAs measured by CCT and TTE as response variable and covariates. Associ- ations of difference between AVACCT and AVATTE with different variables were evaluated by multiple linear regression analysis. P-values less than 0.05 were con- sidered statistically significant. All statistical analysis and related graphics were performed using SAS 9.4, IBM SPSS statistics (IBM, Armonk, NY, USA).
Results
Patients
The median age of the population was 81 years (IQR: 11). The majority (57%) of these patients were females. Patient characteristics of the study cohort are summarized in Table 1. The median calculated STS Predicted Risk of Mortality score was 8.9% (IQR: 5.9). In terms of comorbidity, prevalence of hyper- tension (93.7%), diabetes (43.3%), coronary artery disease (57.4%), chronic pulmonary disease (55.9%), and atrial fibrillation (AF, 42.5%) were high. The CCT image quality was assessed to be excellent or good in 103 (81%) cases and poor but evaluable in 24 (19 %) cases. Aortic valve calcification was grade 1 in 1(1%)
All (n=127)
Values are number (%) or median (Q1, Q3). BMI = body mass index; CABG = coronary artery bypass grafting; EF = ejection fraction; GFR = glomerular fil- tration rate; AV = aortic valve; LVOT = left ventricular outflow track; STS-PROM = Society of Thoracic Surgery Predicted Risk of Mortality; ESKD = end-stage kidney disease
CCT image quality was classified using a 4-point subjective ranking scale as follows: (1) bad; (2) poor, but diagnostic; (3) good; and (4) excellent. Aortic valve Agatston calcium score was evaluated using Syngo Via software (Siemens Medical Solutions, Forchheim, Germany). The aortic valve calcification
Ko S. M. et al.
Aortic Valve Area Measured with CT and TTE
