
Page 17 - Journal of Structural Heart Disease Volume 5, Issue 3
P. 17
Original Scientific Article 56
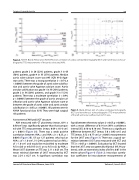
Figure 2. Panel A. Bland-Altman plot. Panel B. Pearson correlation of cardiac computed tomography (CCT) and transthoracic echocar- diography (TTE) measurements of the aortic valve area (AVA).
patient, grade 2 in 28 (22%) patients, grade 3 in 63 (50%) patients, grade 4 in 35 (27%) patients. Median aortic valve calcium score was 845 (IQR: 916) Agat- ston units. There was a strong correlation (r = 0.74, p < 0.0001) between the grade of aortic valve calcifica- tion and aortic valve Agatston calcium score. Aortic annular calcification was grade 1 in 33 (26%) patients, grade 2 in 36 (28%) patients, and grade 3 in 5 (2%) patients. There was a moderate correlation (r = 0.44, p < 0.0001) between the grade of aortic annular cal- cification and aortic valve Agatston calcium score or between the grade of aortic valve and aortic annular calcification (r = 0.33, p = 0.0001). All patients were in NYHA functional class III/IV. They were high surgical risk patients.
Assessment of AVA and LVOT structure
AVA measured with CT planimetry (mean, 0.91 ± 0.30 cm2) was significantly greater than that comput- ed with TTE measurements (mean, 0.69 ± 0.16 cm2; p < 0.001) (Figure 2A). There was a weak positive correlation between AVACCT and AVATTE (r = 0.25, p = 0.004) (Figure 2B). Of our 127 patients who had an AVATTE of < 1.0 cm2, 31 (24%) patients had an AVACCT of > 1.0 cm2 and would be reclassified to moderate AS (n=28) or mild AS (n=1) or no AS (n=2) by AVACCT. Mean LVOT diameter on TTE was 2.11 ± 0.25 cm. The mean minimal diameter of LVOT measured by CCT was 2.24 ± 0.27 cm. A significant correlation was
Figure 3. Bland-Altman plot of cardiac computed tomography (CCT) and transthoracic echocardiography (TTE) measurements of the left ventricular outflow tract (LVOT) area.
found between these two values (r = 0.65; p < 0.0001), with a mean difference of 0.14 cm (95% confidence interval [CI]: 0.10 to 0.18 cm). There was a significant difference between CCT (mean, 5.0 ± 0.92 cm2) and TTE (mean, 3.52 ± 0.77 cm2; p < 0.001) measurements for the LVOT area (Figure 3). There was a good cor- relation between LVOT area measured with CCT and TTE (r = 0.65; p < 0.0001). Evaluation by CCT showed that the LVOT area was generally elliptical (95.3% pa- tients), with an eccentricity index of 0.78 ± 0.07 in the entire cohort (Figure 4) (Table 2). Intra-class correla- tion coefficient for intra-observer measurements of
Journal of Structural Heart Disease, June 2019
Volume 5, Issue 3:52-61
