
Page 22 - Journal of Structural Heart Disease Volume 5, Issue 5
P. 22
215 Original Scientific Article
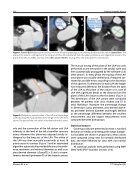
Figure 1. Panel A & B. Multiplanar reconstruction of the left atrial appendage (LAA) showing the plane of the ostium (dotted line). The plane of the ostium is orthogonal to the long axis of the LAA and extends from the upper pulmonary vein ridge (thick arrow) to the plane of the left circumflex coronary artery (thin arrow). Panel C. Tracing of the LAA ostial plane in cross-section..
Figure 2. Multiplanar reconstruction of the left atrial appendage (LAA) showing the measurement of the length of the LAA (thin arrow). The plane of the LAA ostium is marked be the thick arrow.
orly and the connection of the left atrium and LAA inferiorly at the level of the left circumflex coronary artery. Moreover this plane was adjusted strictly or- thogonal to the long axis of the LAA. The orifice of the LAA was then manually traced with at least 18 points across its contour (Figure 1) and an automated algorithm automatically provided the area, circumfer- ence, maximum and minimal diameters as well as an area-derived diameter (√[area/∏] x 2) and a circum- ference-derived (perimeter/∏) of the traced contour.
The manual tracing of the plane of the LAA was only performed at one time point in the cardiac cycle and then automatically propagated by the software to all other phases. In every phase the tracing of the LAA ostial plane was visually verified and, if required cor- rected for possible errors according to the discretion of the observer. Furthermore, for each LAA the length was measured defined as the distance from the apex of the LAA to the plane of the ostium or in case of LAA with significant bends as the distance from the plane of the LAA ostium to the first bend. (Figure 2) The dimensions of the LAA ostium were compared between 48 patients with sinus rhythm and 53 in atrial fibrillation. Moreover the percentage change in dimensions (area, perimeter, area-derived diame- ter, perimeter derived diameter and length) defined as the percentage difference between the smallest measurement and the largest measurement were compared between both groups.
Statistical analyses
Continuous data are presented as mean ± standard deviation or median and interquartile range. Categor- ical variables are shown in proportions. Mean values were compared using t-test for normally distributed data and Mann-Whitney for data with non-normal distribution.
All statistical analyses were performed using IBM® (New York) SPSS® Statistics (version 21.0).
Marwan M. et al.
CT Sizing for LAA
