
Page 24 - Journal of Structural Heart Disease Volume 5, Issue 5
P. 24
217
Original Scientific Article
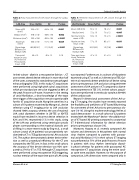
Table 2: Area measurement of LAA ostium through the cardiac cycle.
Table 3: Perimeter measurement of LAA ostium through the cardiac cycle.
LAA Area
Sinus rhythm
AF
P-value
LAA Perimeter
Sinus rhythm
AF
P-value
Mean ±SD (mm2)
Median (mm2) Minimum (mm2)
Maximum (mm2)
Percentage Difference % Median (IQR)
Time point maximum area (%, R-wave to R-wave peak, mean ± SD)
359 ± 131
378 ± 140 233 ± 108 440 ± 150
88 (60;147) 46 ± 13
464 ± 153
468 ± 150 406 ± 169 517 ± 154
21 (13;42) 40 ± 15
0.001
0.002 < 0.001 0.025
< 0.001
0.16
Mean ±SD (mm) Median (mm)
Minimum (mm, mean ± SD)
Maximum (mm, mean ± SD)
Percentage Difference % Median (IQR)
Time point max- imum Perimeter (%, R-wave to R-wave peak, mean ± SD)
69 ± 12 72 ± 13 56 ± 13
77 ± 13 34 (25;52)
47 ± 15
78 ± 12 79 ± 12 73 ± 15
83 ± 11 10 (7;18)
41 ± 19
0.001
0.007 < 0.001
0.031 < 0.001
0.23
In their cohort - albeit in a retrospective fashion - , CT assessment altered device selection in more than half of the cases, compared to standard transoesophageal echocardiography (TEE). In this study, CT acquisitions were performed using high-pitch spiral acquisitions which per standard are set to be triggered at 60% of the peak R-wave to R-wave. However in the setting of atrial fibrillation, a clear knowledge of the exact time trigger of the acquisition remains questionable for this CT acquisition mode. Along the same line, in a cohort of 53 patients examined by Wang et al., device selection using CT imaging prior to LAA occlusion showed 100% accuracy, whereas the use of maximal LAA ostial diameters whether in 2D-TEE or 3D-TEE would have resulted in incorrect device selection in 62% and 53%, respectively [13]. In this study, sizing of the LAA was performed using ventricular systolic phases corresponding to the maximal diastolic atri- al filling. In a more recent study by Eng et al., a small cohort (a total of 24 patients) was prospectively ran- domized to CT vs. TEE guidance prior to LAA occlusion [14]. The authors demonstrated a better device selec- tion as well as procedural efficiency for the CT arm compared to the TEE arm. In fact, in this small cohort, the accuracy of first device selection was 92% com- pared to 27% for CT vs. TEE. Although CT acquisitions were performed using retrospective ECG-triggering, no clear mention of the exact time point of LAA sizing
was reported. Furthermore, in a cohort of 36 patients examined using CT as well as 2-dimensional TEE, Goi- tein et al. reported a better prediction of device sizing prior to percutaneous LAA occlusion using perimeter assessment of LAA ostium in CT compared to diame- ter measurements in TEE [15]. In their cohort, acquisi- tions were performed in ventricular systole at 30-40% of the cardiac cycle.
Beyond 3-dimensional assessment of the LAA us- ing CT imaging, few studies have recently reported the feasibility and usefulness of CT-based 3D printing for assessment of the LAA prior to percutaneous clo- sure [16-18]. Using this modern technology, Hell et al. could demonstrate - in a small cohort of 22 patients treated with the Watchman® device - the additive val- ue of CT-based 3D printing compared to anatomical CT 3-dimensional information for device selection prior to percutaneous closure [16].
Moreover, Hozawa et al. recently compared LAA volume and dimensions in 60 patients with normal sinus rhythm compared to patients with paroxys- mal atrial fibrillation [19]. In their cohort, CT imaging was performed at 75% of the peak R-wave to R-wave in patients with sinus rhythm (ventricular diastol- ic phase) whereas for patients with paroxysmal AF, retrospective CT acquisitions along the entire cardi- ac cycle were available. However, for the purpose of comparison, LAA dimensions were compared only in
Marwan M. et al.
CT Sizing for LAA
