
Page 23 - Journal of Structural Heart Disease Volume 5, Issue 5
P. 23
Original Scientific Article
216
Results
Study population
101 patients were included in this analysis (mean age 81 ± 8 years, 61% males). Patients were divided in two groups: 48 patients in sinus rhythm (SR) and 53 patients in atrial fibrillation (either paroxysmal or persistent). All patients in the atrial fibrillation (AF) group were in AF during the CT acquisition. Baseline characteristics are shown in Table 1. Mean heart rate during the CT exam was 62±9 bpm for patients with sinus rhythms vs. 69±8 bpm in patients in atrial fibril- lation (p=n. s).
Left atrial appendage ostium dimensions
The mean area of the LAA ostium as well as pe- rimeter were significantly larger in AF patients com- pared to SR patients (464±153 vs. 359±131 mm2 and 78±12 mm vs. 69±12 mm for AF vs SR patients, re- spectively, p=0.001). Consequently the area derived diameter as well as perimeter derived diameter were consequently significantly larger in AF vs. SR patients (24±4 mm vs. 21±4 mm and 25±4 vs. 22±4 mm for area-derived vs. perimeter-derived diameter, respec- tively, p<0.001). (Table 2 and 3) The percentage differ- ence between maximal and minimal LAA dimensions were significantly higher for sinus rhythm patients compared to atrial fibrillation [88% (IQR 60; 147 %) vs. 21% (IQR 13; 42%), respectively, p<0.001] for median percentage area change and 34% vs. 10% for median percentage perimeter change (IQR 25;52 vs. 7;18%, respectively, p<0.001) (Figure 3).
For atrial fibrillation patients, the largest LAA di- mensions (area, perimeter, area-derived and perime- ter-derived diameters) was measured at an average of 40% of the peak R-wave to R-wave whereas for sinus rhythm patients, the maximal LAA dimensions were measured at an average of 46% of the peak R-wave to R-wave (p>0.05).
Left atrial appendage length
The mean length of the LAA was significantly larger in AF patients compared to SR patients (19.5 mm vs. 17 mm for AF vs SR patients, p=0.04) and the median percentage change in length was significantly higher in SR vs. AF (32% [IQR 19; 61%] vs. 13% [IQR 9;19%] for SR vs. AF patients)
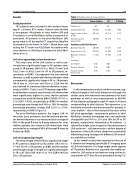
Table 1: Baseline clinical characteristics.
Sinus rhythm
AF
P-Value
Patients (n) Male Gender (%)
Age in years (mean ± SD)
Coronary artery disease (%)
48 30 (62) 80 ± 8
28 (58)
53 32 (60) 82 ± 6
38 (72)
27 (51) 45 (85) 16 (30)
4(8) 4(8) 4 (8)
0.84 0.52
0.21
0.55 0.23 0.50
0.74
1.00
Cardiovascular Risk Factors
Dyslipidemia (%)
Hypertension (%)
Diabetes mellitus (%)
Smoking
Ex-Smoker
Current Smoker
Positive Family History (%)
Discussion
28 (58) 36 (75) 11 (23)
3(6) 2/4) 3 (6)
In this retrospective analysis, we demonstrate a sig- nificant change in LAA ostial dimensions through the cardiac cycle with maximum measurements for both perimeter as well as area measurements at 40-50% of the electrocardiographic peak R- wave to R-wave corresponding to atrial diastole. This dynamism is, as intuitively assumed more pronounced for patients in sinus rhythm – due to the contractile function of the left atrial appendage - compared to patients in atrial fibrillation (median percentage area and perimeter change 88% and 34% vs. 21% and 10% for SR vs. AF patients, respectively). Nevertheless, AF patients – a subset that might come in question for percutaneous LAA occlusion – still demonstrate a certain degree of dynamism of the LAA ostium dimensions potentially influencing sizing strategies for different LAA occlud- ers available on market.
So far, several studies have reported on the use of 3-dimensional imaging (specifically CT imaging) prior to LAA interventions. In a large single center registry of 73 patients, Rajwani et al. reported a favorable out- come for LAA occlusion procedures using routine in- corporation of CT data for pre-procedural sizing [12].
Journal of Structural Heart Disease, October 2019
Volume 5, Issue 5:213-220
