
Page 32 - Journal of Structural Heart Disease Volume 5, Issue 6
P. 32
Original Scientific Article 256
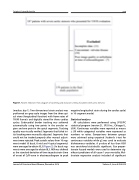
Figure 1. Patient Selection. Flow diagram of screening and exclusion criteria of patients with aortic stenosis.
(median, day 1). Two-dimensional strain analysis was performed on grey-scale images from the three api- cal views (longitudinal function) with frame rates of 70-90 frame/s and digitally stored for three cardiac cycles. Endocardial border tracking was achieved automatically using two points in the annular re- gion and one point in the apical segments. Tracking quality was visually verified. Segments that failed ini- tial tracking were manually adjusted. Segments that could not be tracked properly after manual adjust- ment were rejected. Peak systolic values from 16-seg- ment model (6 basal, 6 mid and 4 apical segments) were averaged to obtain GLS (Figure 2). Six basal seg- ments were averaged to obtain BLS. MD was defined as the standard deviation of time to peak strain (time of onset of Q/R wave in electrocardiogram to peak
negative longitudinal strain during the cardiac cycle) in 16- segment model.
Statistical analyses
All calculations were performed using SPSS/PC statistical program (version 21, SPSS Inc., Chicago IL, USA). Continuous variables were reported as means ± SD while categorical variables were expressed as numbers or ratios. Comparisons between groups were achieved using unpaired Student’s t-test for continuous variables while χ2 was used to evaluate dichotomous variables. A p-value of less than 0.05 was considered statistically significant. Cox propor- tionate hazard models were used to determine sig- nificant predictors of all-cause 1-year mortality. Mul- tivariate regression analysis included all significant
Journal of Structural Heart Disease, December 2019
Volume 5, Issue 6:254-262
