
Page 34 - Journal of Structural Heart Disease Volume 5, Issue 6
P. 34
Original Scientific Article
258
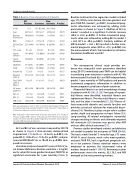
Table 1. Baseline clinical characteristics of all patients.
Baseline multivariate Cox regression model included age, STS, NYHA, renal disease, AV mean gradient, and post-TAVR PVL (model 1, p<0.001). Incremental prog- nostic information was achieved by adding strain parameters as shown in Figure 3. Addition of GLS to model 1 resulted in a significant C-statistic increase (40.6 vs. 34.3, p=0.032). A further incremental prog- nostic value was achieved by adding BLS to model 1 + GLS (47.5 vs. 40.6, p=0.001). Similarly, addition of MD to model 1 + GLS + BLS resulted in further incre- mental prognostic value (50.9 vs. 47.5, p=0.008). For the measurement of GLS, the Interobserver Intraclass Correlation Coefficient was 0.87.
Discussion
This retrospective clinical study provides evi- dence that myocardial strain parameters identified using 2D-STE immediately post-TAVR can be helpful in predicting poor outcomes in patients with AS. We demonstrated that both BLS and MD independently predict 1-year mortality in TAVR patients and provide incremental prognostic information in addition to known prognostic predictors of poor outcomes.
Myocardial fibrosis is an early morphologic change in patients with AS [18, 25, 26]. Two types of myocar- dial fibrosis were identified, interstitial fibrosis and replacement fibrosis. The interstitial fibrosis is revers- ible, and the latter is irreversible [27, 28]. Fibrosis af- fects myocardial diastolic and systolic function and provides a structural substrate for myocardial desyn- chrony [34]. Therefore, it plays a major role in sudden cardiac death and progression to heart failure [35]. Long-standing AS-related maladaptive myocardial changes resulting in fibrosis and ultimately impaired left ventricular (LV) function may persist after AVR and can affect clinical outcomes [31].
Previous studies developed a robust and definitive risk model to predict the outcomes of TAVR [36-38]. The basic model (model 1) included age, STS score, NYHA IV, renal disease, aortic valve mean-gradient, and post-TAVR PVL had a significant prognostic val- ue in our patients. Various statistical metrics were employed to examine the incremental value of markers beyond model 1 [38-39]. Reviewing marker performances across the metrics, GLS, BLS, and MD emerged as the most promising markers.
All Patients
Survivors
Non- survivors
P-value
N (%) Age
Gender (Female %)
BMI
NYHA Class IV
STS score
Hyper- tension
Hyper- lipidemia
Diabetes
CAD
Creatinine
Baseline LVEF, %
Post-TAVR LVEF, % (Day1)
AV mean gradient
GLS, % BLS, % MD, msec
159 80.7±9.1 78 (49.0%)
29.2±7.4 22 (13.8%)
6.1±4.1 141 (89%)
98 (62%)
67 (42%) 111 (70%) 1.5±1.3 55.3±15.4
59±15
46.2±16.4
-13.7±4.1 -12.9±3.2 72.8±27.8
131 (82.4%) 80.1±9.7 64 (49%)
29.7±7.6 14 (10.6%)
5.6±3.7 115 (88%)
78 (60%)
50 (38%) 89 (68%) 1.4±1.3 55.9±15.0
61 ±14.5
48.3±16.4
-14.2±4.0 -13.3±3.2 70.0±25.8
28 (17.6%) 83.5±4.9 14 (50%)
27.2±5.7 8 (28.5%)
8.1±5.4 26 (93%)
20 (71%)
16 (57%) 22 (79%) 1.6±1.0 52.2±17.2
55±17
36.3±12.0
-11.2±3.1 -10.9±1.9 85.8±33.4
- 0.073 0.913
0.103 0.013
0.004 0.445
0.243
0.065 0.269 0.515 0.224
0.053
0.001
0.001 0.001 0.006
Data are expressed as mean ± SD or as number (percentage). Comparisons were performed using unpaired Student’s T tests or χ2 tests. P-value refers to comparisons between survivors and nonsurvivors.
BMI: body mass index; NYHA: New York Heart Association; STS: Society of Thoracic Surgery; CAD: coronary artery disease; LVEF: left ventricular ejection fraction; AV: aortic valve; GLS: global longitudinal strain; BLS: basal longitudi- nal strain; MD: mechanical dispersion.
GLS and BLS of non-survivors measured by 2D-STE as shown in Figure 2. Non-survivors demonstrated impaired GLS (-11.2±3% vs. -14.2±4%, p=0.001), im- paired BLS (-10.9±2% vs -13.3±3%, p=0.001), and pro- nounced MD (86±33 ms vs 70±26 ms, p=0.006) com- pared to survivors.
Univariate analyses showed STS score, NYHA IV, re- nal disease (defined as baseline creatinine > 2 mg/dl), aortic valve (AV) mean gradient and post-TAVR PVL as significant univariates for 1-year mortality (Table 2).
Journal of Structural Heart Disease, December 2019
Volume 5, Issue 6:254-262
