
Page 33 - Journal of Structural Heart Disease Volume 5, Issue 6
P. 33
257 Original Scientific Article
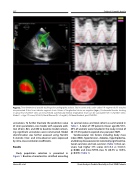
Figure 2. Two-dimensional speckle tracking echocardiography analysis. Strain curves and a color-coded 16-segment bull’s eye plot are presented. Color lines indicate regional strain. Values of longitudinal strain are negative (sign -). Endocardial border tracking in apical four-chamber view can be achieved automatically. Global longitudinal strain can be calculated from 4 chamber views. Model 1 = Age, STS score, NYHA IV, Renal Disease (Cr >2 mg/dL), AV Mean Gradient, post-TAVR PVL.
univariates. To further illustrate the predictive value of strain parameters, cox models with separate addi- tion of GLS, BLS, and MD to baseline model contain- ing significant univariates were constructed. Model discrimination was further assessed using Harrell’s C-statistic. Inter- and intra-observer were expressed by intra-class correlation coefficients.
Results
Study population selection is presented in Figure 1. Baseline characteristics stratified according
to survival status and total cohort as summarized in Table 1. A total of 159 patients (mean age 80.7±9.1, 49% of women) were included in the study. A total of 28 (17.6%) patients expired one-year post-TAVR.
Cardiovascular risk factors including body mass index (BMI), hypertension, diabetes, hyperlipidemia, and kidney disease were not statistically significant be- tween survivors and non-survivors (Table 1). Non-sur- vivors had higher STS scores (8.1±5.4 vs 5.6±3.7, p=0.004) and more NYHA class IV (28.5% vs 10.6%, p=0.013) (Table 1).
Hemu M. et al.
Strain Analysis Predicts Mortality in Post-TAVR Patients
